Whole-body scanning has existed in apparel research since the early 2000s, when the SizeUSA survey scanned roughly 10,000 people across the United States and SizeUK scanned a comparable sample in Britain, and the core finding has never changed: populations are far more variable in shape than standard size charts assume. A scanner, which is an optical device that captures hundreds of body measurements in seconds, turns fit from a matter of guesswork into a matter of statistics. Most brands, as of early 2026, still design on a single fit model and grade outward.
What is whole-body scanning?
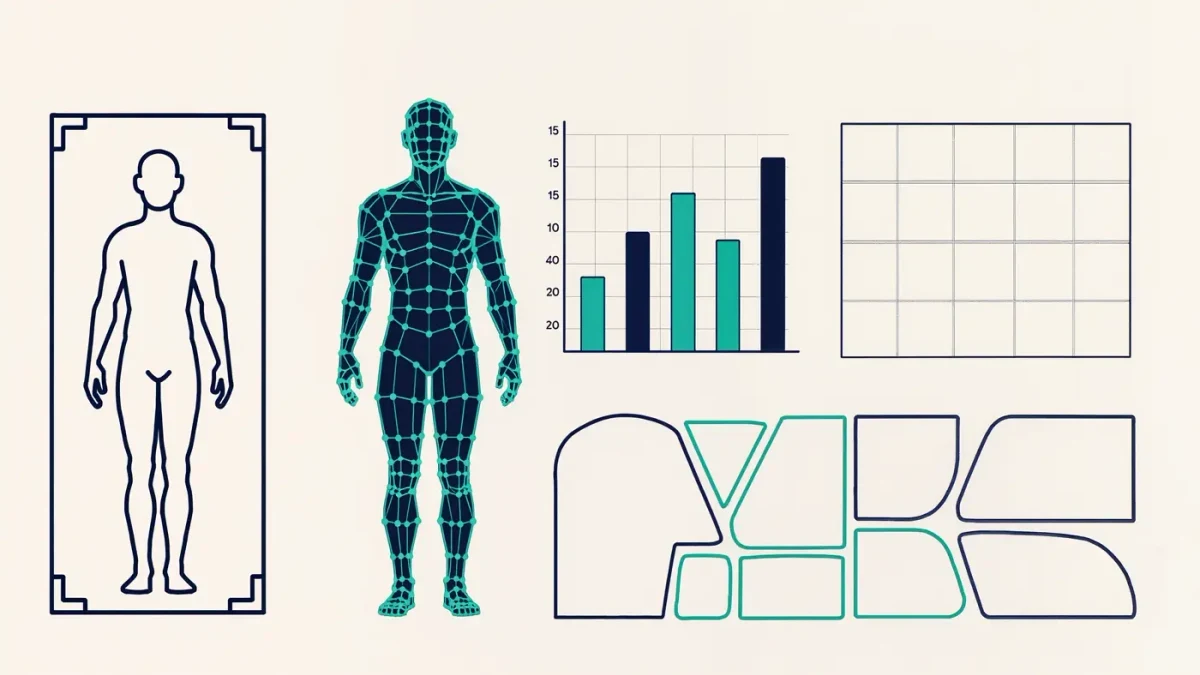
A whole-body scanner projects light onto a standing subject and reconstructs the body as a point cloud, from which software extracts circumferences, lengths, and derived measurements such as back neck to wrist. Consumer systems in stores work on the same principle at lower resolution. The subject stands in a booth or in front of a camera array, holds a standardized pose for seconds, and leaves with a measurement file, typically dozens to hundreds of dimensions per person.
The landmark public projects set the template. SizeUSA, conducted in 2002-2003 with support from the apparel industry and government partners, scanned thousands of men and women at sites across the country and produced the first statistically defensible picture of American body shape variation. SizeUK ran in parallel in Britain with university backing, and later efforts such as CAESAR in earlier years and various national surveys elsewhere confirmed the same pattern on other populations.
What did the national surveys actually find?
The findings that matter to apparel fall into three groups, and each one contradicts a common assumption in patternmaking.
- Size labels describe length more than girth. A large share of people who buy one labeled size have body dimensions that would place them in two or three different sizes on a chart, because height and circumference vary independently.
- Shape categories matter more than scale. The same waist measurement sits on bodies with very different hip-to-waist and bust-to-waist ratios, which is why a chart that fits one shape fails another at identical girth.
- Average dimensions drift over generations. Survey re-measurement shows populations growing taller and heavier across decades, while many size charts stay frozen on blocks drafted decades earlier.
None of these results required exotic interpretation; they come straight from comparing distributions of measured dimensions to the ranges implied by commercial size charts. The gap between the data and industry practice is what persists.
How does scan data become fit decisions?
Turning a population of point clouds into a size chart is a statistics exercise, and the standard pipeline looks like this.
- Extract the key dimensions that drive the garment's fit block, such as bust, waist, hip, and nape to waist for a fitted bodice.
- Cluster the population into shape groups, not just size steps, so that each cluster shares proportion as well as scale.
- Decide how many sizes and shapes the line will actually serve, which is a business trade-off between coverage and inventory depth.
- Draft or adjust blocks so each shape cluster is addressed, either through separate base blocks or through graded proportions.
- Validate on real wearers from the target distribution, using fit sessions sampled by measured dimensions rather than by labeled size.
Step three is where most brands stop short. The data may say a line needs six shape variants to cover the population, but producing six fit variants multiplies development and inventory costs, so companies compromise on two or three and accept misfit at the edges.
Why has the industry been slow to act on it?
The barrier is not measurement technology, which has become cheap, but the cost structure of responding to what the measurements say. Sizing up a line to serve real population variance means more blocks, more fit sessions, more size set samples, and inventory risk across additional variants. A brand's incentive is to cover the widest span of buyers with the fewest labeled sizes, and generous ease plus stretch fabric have historically absorbed part of the mismatch.
Fit models compound the problem. A single fit model represents one body from the entire distribution, and grading rules applied outward from that body inherit its proportions as law. Survey data from SizeUSA onward showed exactly how misleading that is, yet the fit model remains the default reference because it is immediate, tactile, and familiar to pattern rooms.
What is the data used for today?
By the mid-2020s the most common commercial uses sit downstream of patternmaking, summarized below.
| Use case | What the scan data does | Maturity as of 2025 |
|---|---|---|
| Size chart design | Sets size steps and proportion variants from population distributions | Used by larger brands and uniform makers; rare among independents |
| Fit model selection | Chooses a fit model near the center of the measured target distribution | Common where data is available |
| Fit recommendation tools | Maps a shopper's measurements to the brand's garment dimensions | Established, fed by return-rate outcomes |
| Made-to-measure | Drives cutting dimensions directly from an individual scan | Niche but growing in workwear and formalwear |
Government measurement science has supported parts of this stack; NIST's work on anthropometric data standards and related federal survey practice shaped how dimensions are defined and captured, which is why scan outputs from different vendors can be compared at all.
Does scanning a shopper improve fit for that shopper?
Only if the brand's garments are themselves measured and mapped honestly. A scan of a customer is half the equation; the other half is accurate garment measurement data, meaning actual produced dimensions rather than chart intentions. Where both sides exist, a recommendation engine can place a shopper in the size with the smallest dimensional gap, and published retail accounts through 2025 associate such engines with measurable reductions in fit-driven returns. Where the garment side is fantasy, the scan adds precision to a guess.
What should a brand do with the population data that already exists?
The public surveys are finished work; a brand does not need to scan anyone to benefit from them. The minimum useful program is to compare its current size chart against published population distributions for its market, identify which shape clusters its current blocks serve and which they miss, and sample its fit sessions by measured dimension. Teams that do this typically discover that their smallest and largest labeled sizes are drafted for bodies that barely exist in the target population, and that a mid-range shape variant would cover more customers than another point on the size scale.
Scanning becomes necessary when a brand sells into a market the public surveys did not cover, or when made-to-measure is the business model. In both cases the lesson from two decades of body scanning stands: the data has been good since the early 2000s, and the constraints on better fit have been economic ever since.
What did later measurement projects add?
The early national surveys were followed by specialized measurement programs that sharpened specific questions. Military anthropometric surveys, conducted to size equipment and protective gear, contributed some of the largest standardized body databases in existence and demonstrated rigorous measurement protocol design, including pose standardization and landmark definition, that commercial projects borrowed freely. Academic studies through the 2010s added motion capture and 4D scanning, which record the body in poses rather than in a single stance, addressing the standing-pose limitation that constrains static scans for activewear design.
E-commerce supplied a different kind of dataset. Fit surveys, return reasons, and shopper-reported dimensions accumulated by online retailers in the 2010s and 2020s produced behavioral fit data at a scale the scanning surveys never reached, though with noisier measurement. The two data families complement each other: scans give accurate dimensions without purchase context, and commerce data gives purchase outcomes without accurate dimensions. Fit research through the mid-2020s increasingly combined them.
The practical inheritance for a 2026 planning team is a well-documented public baseline. Population dimension tables derived from the national surveys remain available for the markets they covered, and published papers describe the clustering methods that convert raw dimensions into shape categories. A brand does not need proprietary scanning to start evidence-based sizing; it needs the discipline to compare its charts against what was measured, and honesty about which customers its current blocks quietly exclude.